
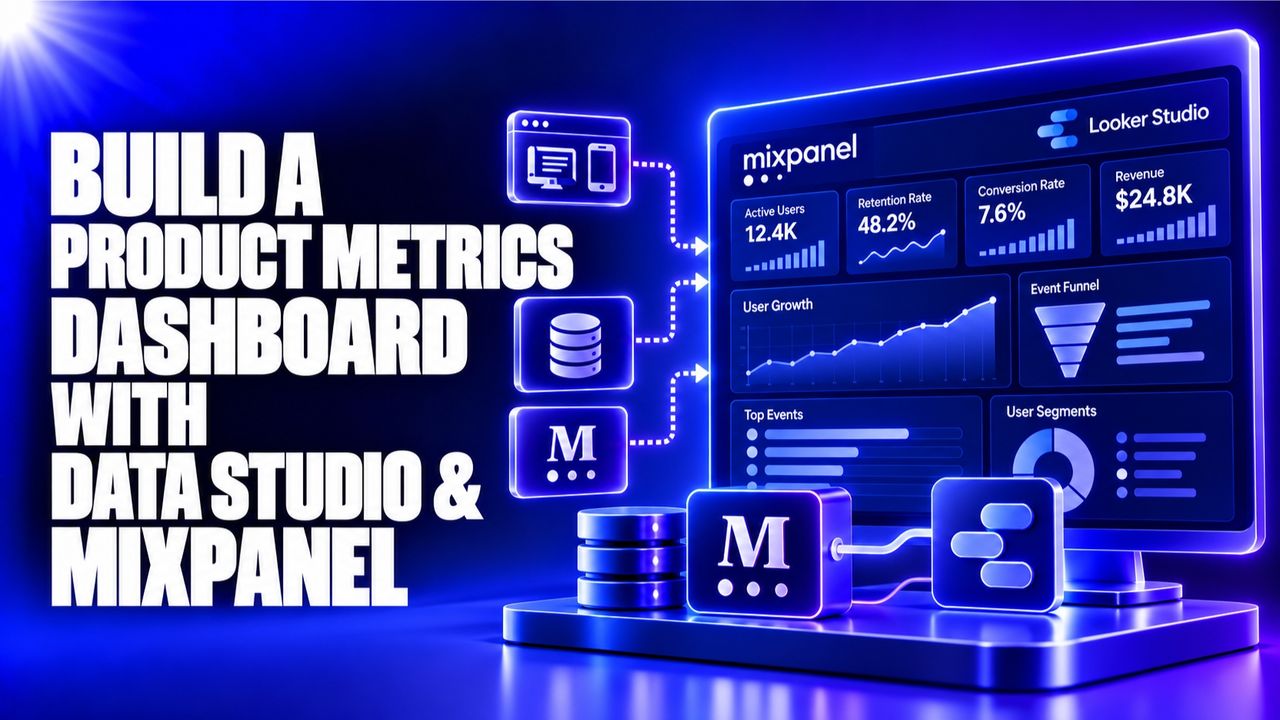
This beginner‑friendly course is for Indian students and career‑switchers who want a concrete, job‑ready skill in product analytics. You'll learn the basics of event tracking, data extraction, and visual storytelling, then apply them to build a real‑world dashboard.
By the end of the week you will have a fully functional, shareable dashboard that shows key product metrics such as user activation, retention, and revenue trends. The dashboard can be used in interviews or as a portfolio piece to demonstrate your analytics chops.
After completing the course you’ll be able to set up Mixpanel tracking, pull data into Google Data Studio, design insightful visualisations, and explain metric choices to stakeholders.
 Introduction to Product Analytics
EverBee · 14 min
2
Introduction to Product Analytics
EverBee · 14 min
2
 Setting Up a Mixpanel Account
Ruben Ugarte · 25 min
3
Setting Up a Mixpanel Account
Ruben Ugarte · 25 min
3
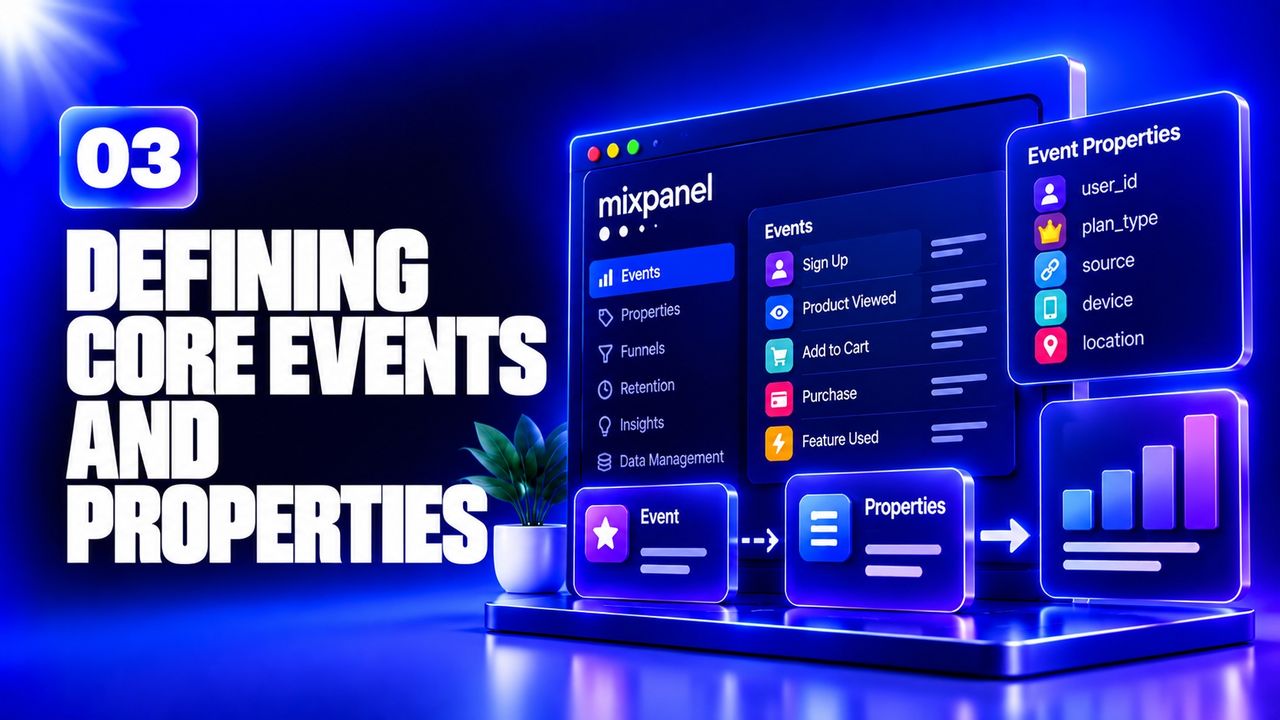 Defining Core Events and Properties
Ruben Ugarte · 25 min
4
Defining Core Events and Properties
Ruben Ugarte · 25 min
4
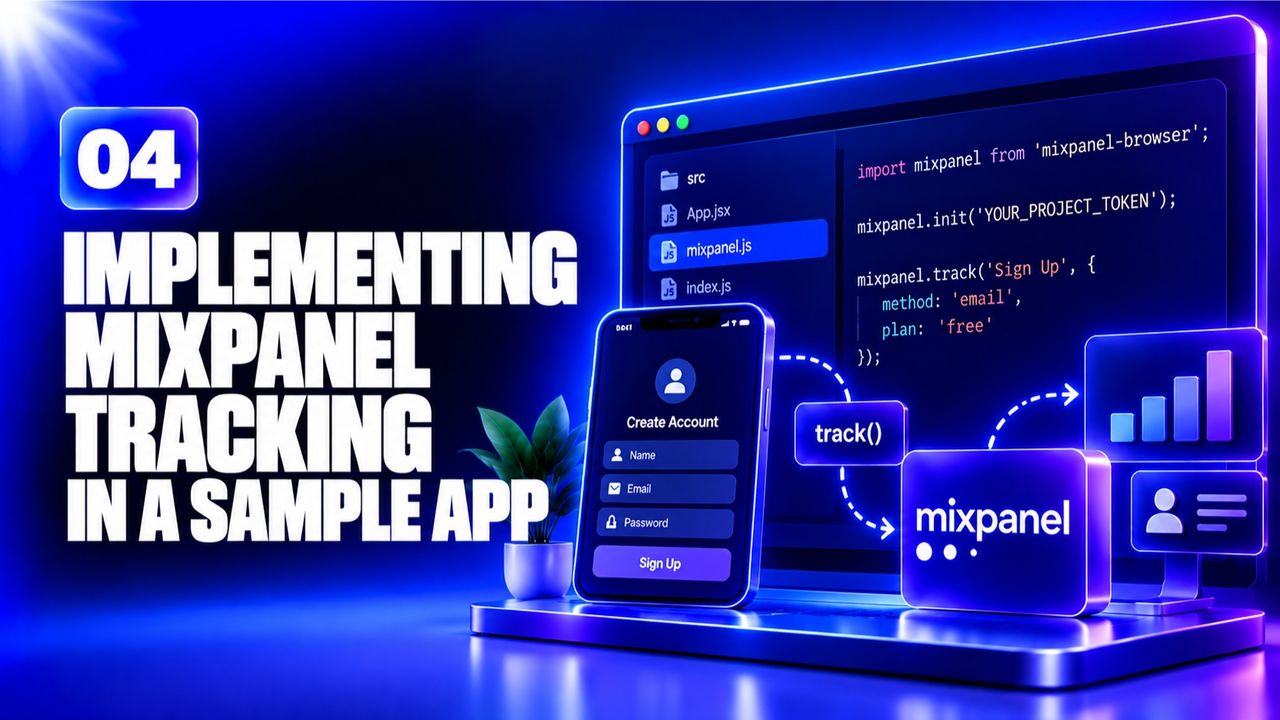 Implementing Mixpanel Tracking in a Sample App
ithinktechnologies · 11 min
5
Implementing Mixpanel Tracking in a Sample App
ithinktechnologies · 11 min
5
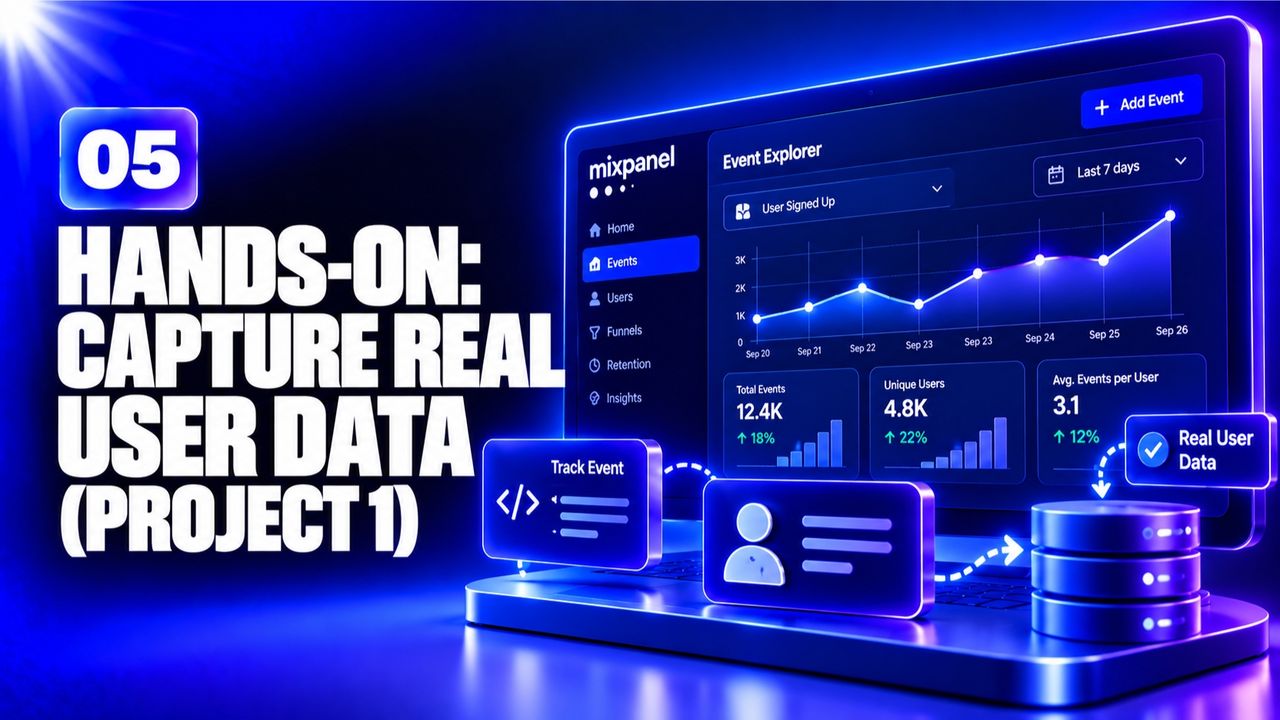 Hands‑On: Capture Real User Data (Project 1)
Ruben Ugarte · 23 min
6
Hands‑On: Capture Real User Data (Project 1)
Ruben Ugarte · 23 min
6
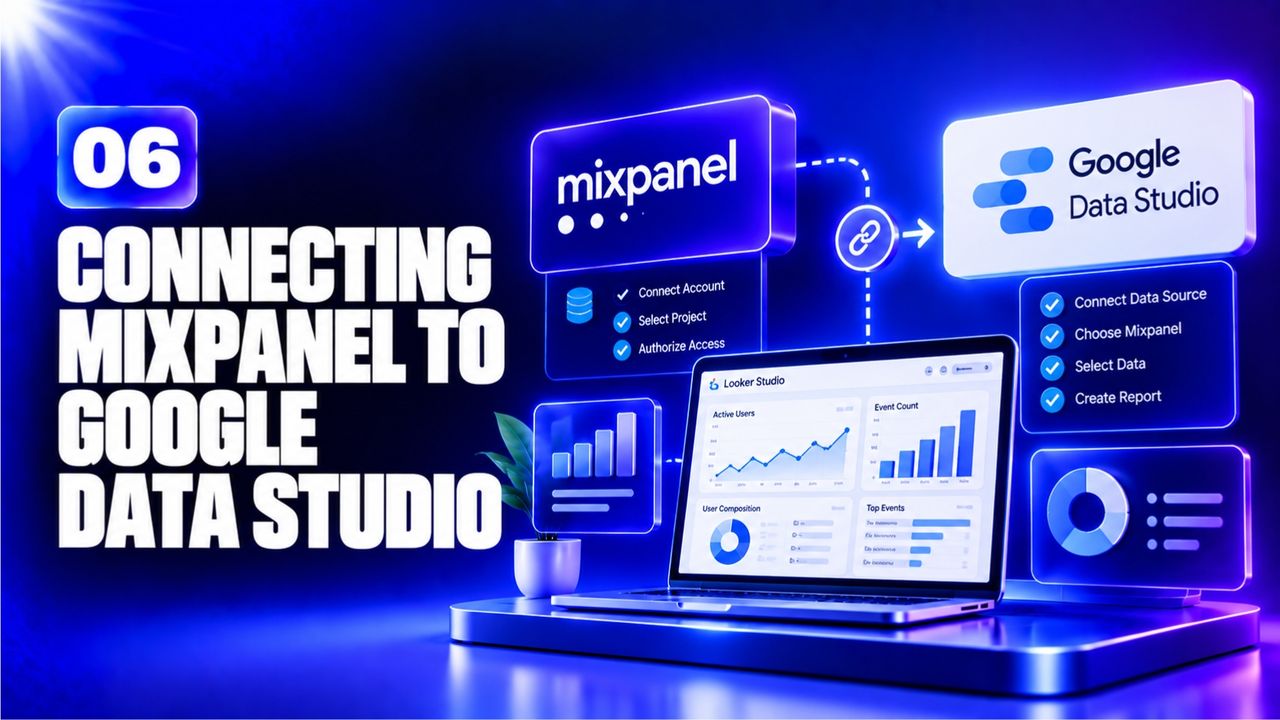 Connecting Mixpanel to Google Data Studio
MeasureSchool · 12 min
7
Connecting Mixpanel to Google Data Studio
MeasureSchool · 12 min
7
 Designing Core Visualisations
MeasureSchool · 12 min
8
Designing Core Visualisations
MeasureSchool · 12 min
8
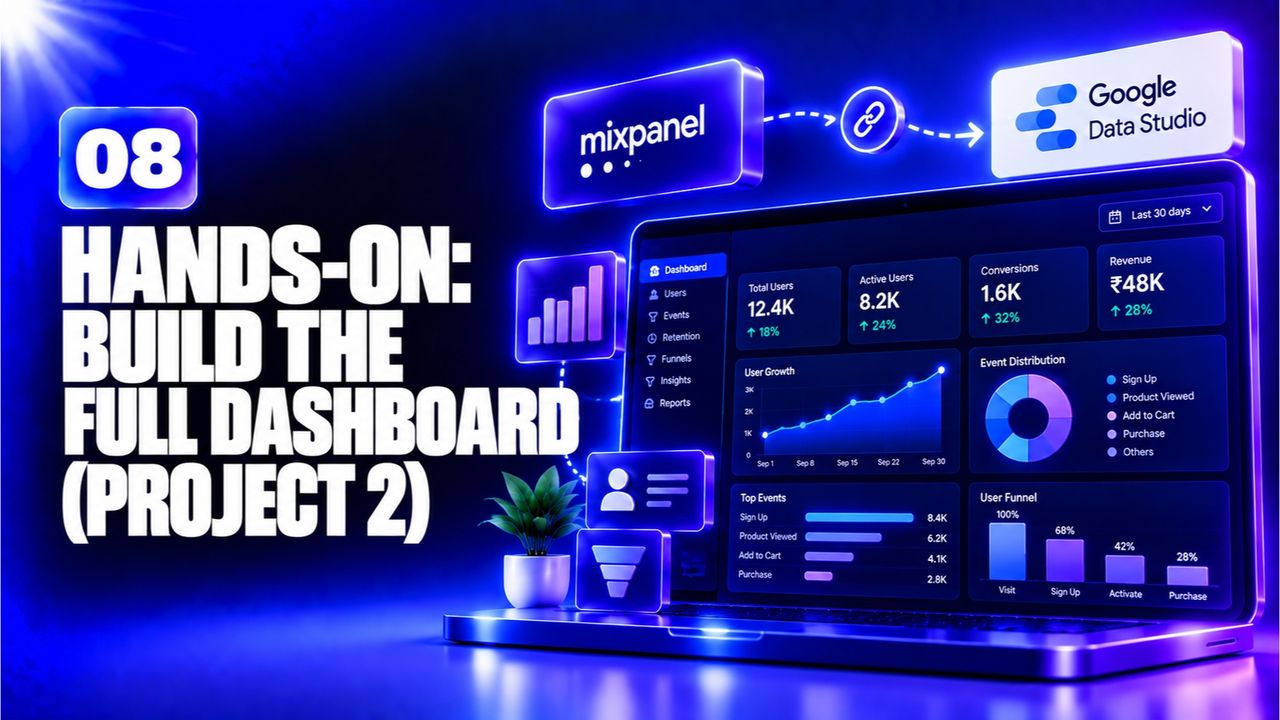 Hands‑On: Build the Full Dashboard (Project 2)
Loves Data · 23 min
9
Hands‑On: Build the Full Dashboard (Project 2)
Loves Data · 23 min
9
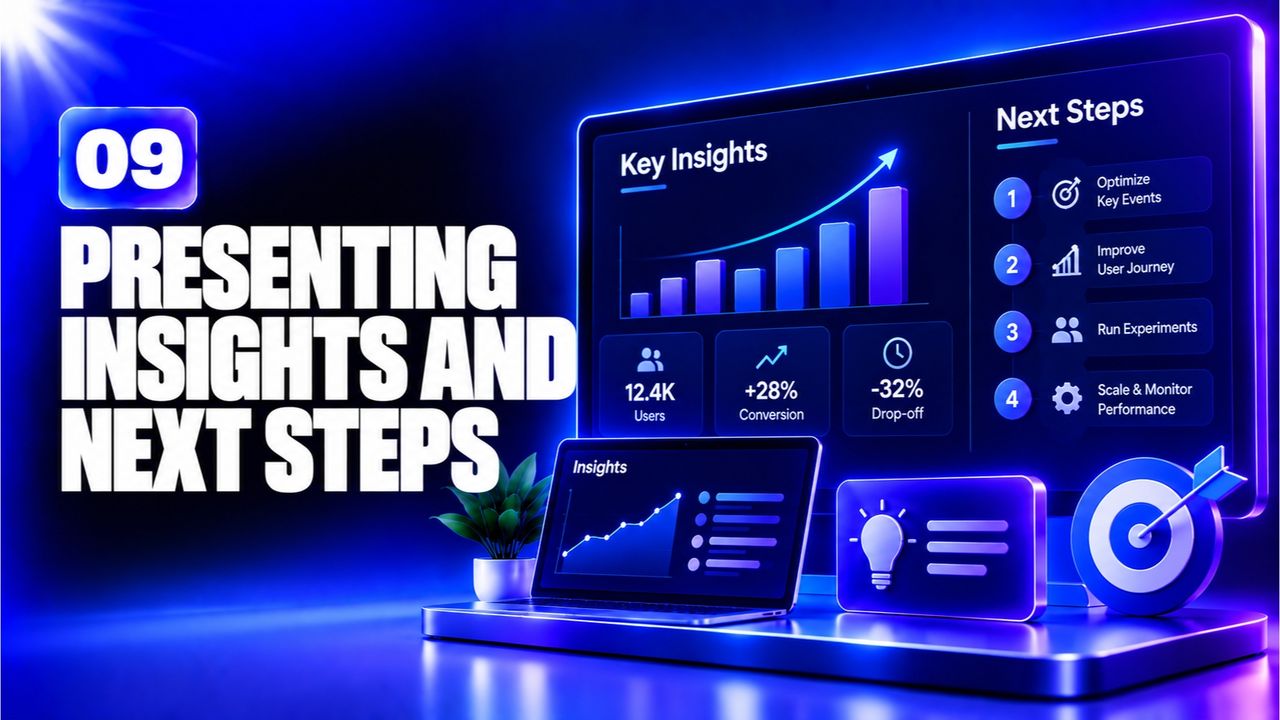 Presenting Insights and Next Steps
Google Cloud Tech · 4 min
Presenting Insights and Next Steps
Google Cloud Tech · 4 min