
Video by Loves Data on YouTube · 23 min. We did not make this video and we do not host it — watching it here still counts as a view for the creator.
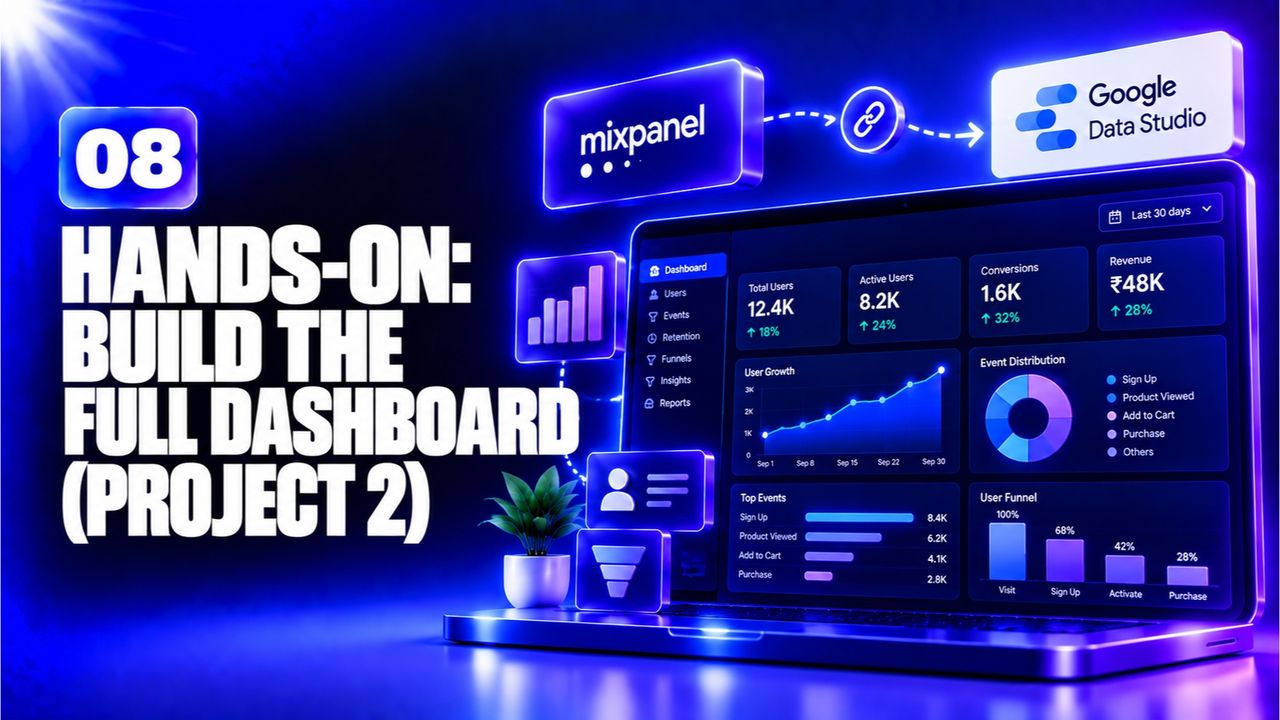
Combine the tables, scorecards, funnel, and cohort charts into a single report page. Use the layout grid to align widgets and add a header with the product name. A common mistake is forgetting to set the report’s sharing permissions to “Anyone with the link”, which blocks reviewers.
Test the dashboard on a mobile preview; ensure fonts are readable and filters work. A polished dashboard demonstrates both analytical and design skills to potential employers.
Sign in with your email, Google or GitHub. No password to remember. The same account carries your progress, your certificates and anything else you do with Nexgino later.
Sign in to continueIt takes about fifteen seconds.